Scatterplot in R
Scatterplot
A scatterplot appears to be the simplest representation of the realtionship between two numeric variables. They can be drawn as points with x- and y-coordinates into a coordinate system using the plot()-function . The plot()-function has a lot of arguments in order to adjust the look of the plot (e.g. the poicht character pch =, the character extent cex =, the axis limits xlim = ylim =, and much more.)
The help pages ?plot and ?par are worth a look!
The lines()-function adds other lines to the plot, a polygon, e.g. representing a confidence interval, can be added using the polygon()-function.
Some more explanations and examples can be found in this Video (in German): Scatterplot R
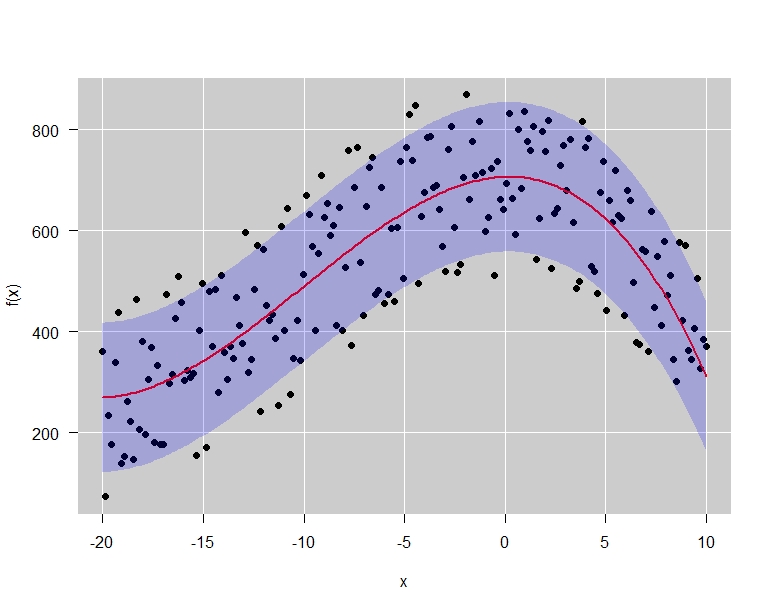
This graphic was created using the following code:
x <- seq(-20, 10, len = 200)

fn <- 705.87 + 1.201 * x + -3.0554 * x^2 + -0.10117 * x^3
jfn <- jitter(fn, 10000)

plot(x, jfn, ylab = "f(x)", las = 1)
rect(par("usr")[1], par("usr")[3], par("usr")[2], par("usr")[4], col = "grey80")
for(i in seq(-20, 10, 5)) abline(v = i, col = "white")
for(i in seq(200, 800, 200)) abline(h = i, col = "white")
points(x, jfn, pch = 19)
lines(x, fn, lwd = 2, col = "red")
polygon(c(x, rev(x)), c(fn - sd(fn), rev(fn + sd(fn))), col = adjustcolor(4, 0.2), border = NA)
Tags
Scatterplot, cloud of points, trend line, confidence interval, different colors, colours, transparency, background colors, dependent size, dependent colors, x-axis, y-axis, bottom, left, top, right, labels, without ggplot