Dr.R

Laden...

Scatterplot in R

A scatterplot appears to be the simplest representation of the realtionship between two numeric variables...

Barplot in R

Barplots are a good choice to show frequencies of several groups...

Boxplot in R

With a boxplot you can show the distribution of your data easily...

Piechart in R

A piechart helps to present frequencies and relationships of frequencies...

Bubbleplot in R

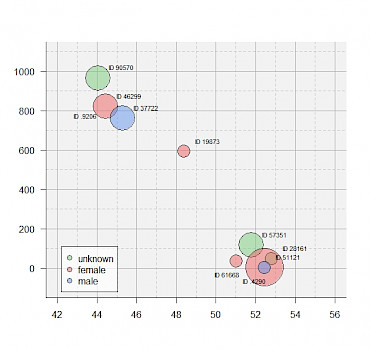
The bubbleplot is an extension of the scatterplot. Transparent colours and different sizes in dependence of other variables make the scatterplot a bubbleplot...

Map in R

Maps and other GIS operations can be processed very nicely in R as well!

Polarplot in R

The polarplot presents directions and angles. There are several polarplot functions from different packages. In my oppinion, the polar.plot() function from Paul Murrell is the best option...